A local divide: Why are Universities in the same city recruiting such different demographics?
Creating fairer access and reducing admission barriers is a shared aspiration across the higher education sector, and while some universities are already making great strides, others still have some progress to make. Mapping out the exact pathways and barriers prospective students face is highly complex, and relying on enrolment statistics alone fails to capture the full picture.
To help universities uncover opportunities for progress, the Social Mobility Commission has published Who Gets In? University Benchmarks for social mobility, a report which provides a new ‘diagnostic tool’ designed for universities to pinpoint if they have barriers in their enrolment processes. This report is based on our new Social Mobility Coefficient which compares the socio-economic background of a university’s student intake with the pool of prospective students that met its entry criteria. This measure allows us to look beyond the well-documented academic attainment gap – to instead focus on how well individual universities are doing in attracting and accepting academically qualified students from disadvantaged backgrounds.
There are a number of structural and social factors that have the potential to shape a student’s journey and university choice – here, we do a deep dive into neighbouring universities within the same city to see how their enrolments differ. By focusing on specific cities, we can assume geographic preferences of prospective students can be taken out of this wide mix of factors influencing choice.
For consistency, here we use our non-location adjusted Social Mobility Coefficient, however the report and our online tool allows you to toggle between adjusted and unadjusted location coefficients. Well known, higher-tariff universities tend to recruit nationally so it is more accurate to use the non-location coefficient, whereas the intakes of regional institutions tend to recruit more local students and therefore are more influenced by regional demographics, so it is more accurate to use the location-adjusted.
Social mobility coefficient (without location adjustment) of universities in the selected cities.
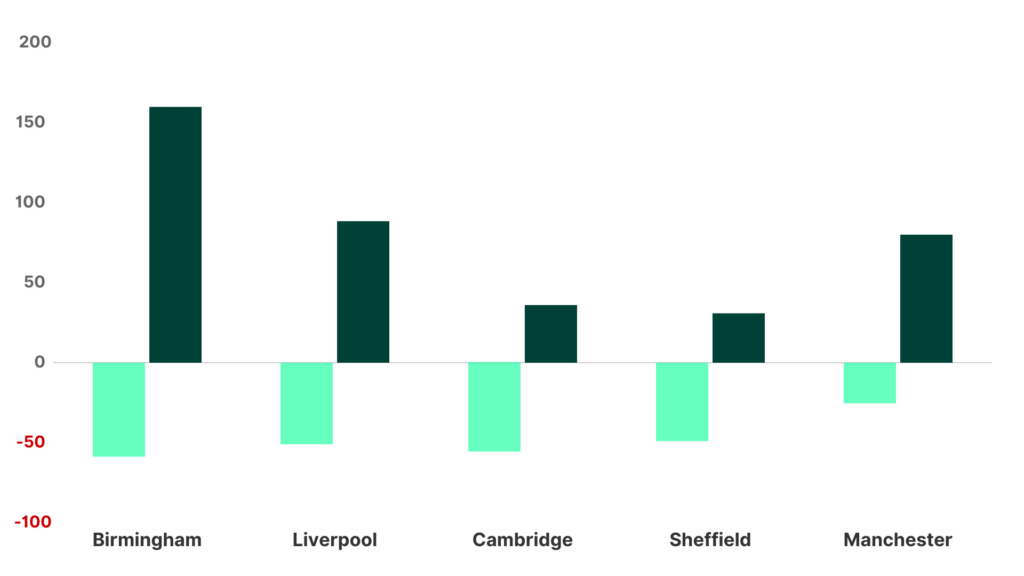
Birmingham: The University of Birmingham (-54), Birmingham City University (152)
Liverpool: The University of Liverpool (-49), Liverpool Hope University (84)
Cambridge: The University of Cambridge (-51), Anglia Ruskin University (38)
Sheffield: The University of Sheffield (-40), Sheffield Hallam (29)
Manchester: The University of Manchester (-18), Manchester Metropolitan University (72)
A clear pattern emerges for most cities: universities with the highest entry requirements regularly have intakes underrepresenting students from a lower socio-economic background compared to those with the required grades, while those with the lower entry requirements have a positive coefficient, indicating that they recruit more disadvantaged students.
For example, in Birmingham, The University of Birmingham (a higher-tariff university) has a social mobility coefficient score of -54, whereas Birmingham City University (a lower-tariff university) has a score of 152. This pattern remains consistent across eight cities included in the report, with the exception of four outliers.
Shared Negative Coefficients
In Nottingham, Bristol and Oxford, both the higher tariff universities (The University of Nottingham, The University of Bristol and The University of Oxford) and the lower tariff universities (Nottingham Trent, The University of The West of England and Oxford Brookes) recorded negative coefficients. Oxford Brookes University stands out as a unique case – despite its lower entry requirements, it frequently serves as a popular choice for students from a higher socio-economic background.
Social mobility coefficient (without location adjustment) of universities in the selected cities.
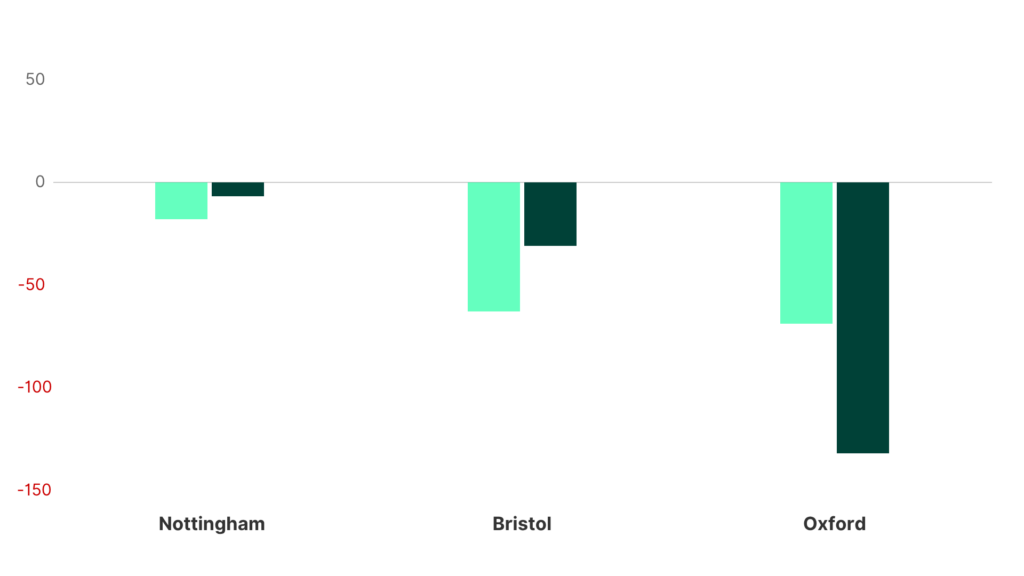
Nottingham: The University of Nottingham (-18), Nottingham Trent University (-7)
Bristol: The University of Bristol (-63), The University of The South West of England (-31)
Oxford: The University of Oxford (-69), Oxford Brookes University (-132)
Shared Positive Coefficients
Conversely, in Southampton and Warwick, all universities in these cities achieved positive coefficients. While the lower-tariff options (Solent University in Southampton and Coventry University in Warwick) still have higher coefficient scores than higher-tariff options (The University of Southampton and The University of Warwick), this demonstrates that positive social mobility progress is fully achievable across different tiers of institutions operating within the same city.
Social mobility coefficient (without location adjustment) of universities in the selected cities.
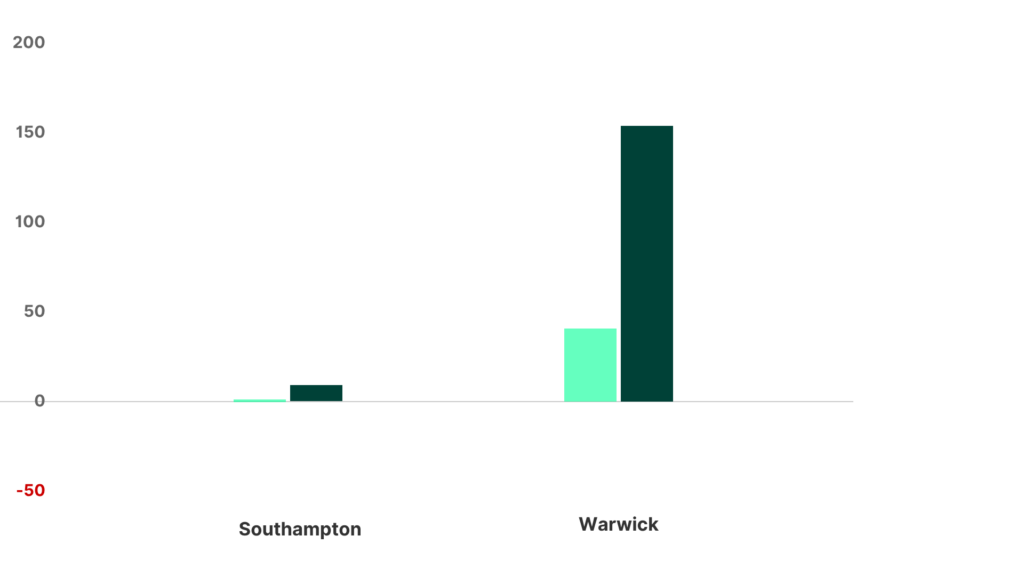
Southampton: The University of Southampton (1), Solent University (9)
Warwick: The University of Warwick (41), Coventry University (154)
Looking Ahead
This highlights an opportunity for regional collaboration – rather than competition. As recommended in Who gets in? University benchmarks for social mobility, cultivating a fairer enrolment landscape could be achieved through building strategic, place-based partnerships. By actively joining regional networks, alongside further education colleges and employers, universities can co-design inclusive, flexible pathways such as foundation years and collaborative degrees. Ultimately, this co-operative approach allows the sector to support disadvantaged students directly while ensuring higher education is aligned with local labour market needs.
Read More
- Read more about our national findings and trends here.
- Reach our full report and recommendations in Who gets in? University benchmarks for social mobility
Related content

Do postcodes drive privilege?
There is frequent discussion of how your socio-economic background, parent’s occupation and school determine your academic achievements, job prospects and future income. But what happens when you keep climbing the… read more
Topics

Why do London Universities rank higher for social mobility than other regions in England?
The Social Mobility Commission recently released – Who gets in? University Benchmarks for better social mobility. This report shares rankings for English universities based on how well they are enrolling… read more
Topics

Social Mobility Symposium: Speech highlights from Angela Rayner, Helen Whately and Lord Blunkett
Today, Tuesday 23rd June, the Social Mobility Commission hosted our 2026 Social Mobility Symposium in Westminster. Three keynote speakers, four panels and more than 20 panelists – from across the… read more