
Download a PDF of the full report
About the Commission
The Social Mobility Commission is an independent advisory non-departmental public body established under the Life Chances Act 2010 as modified by the Welfare Reform and Work Act 2016. It has a duty to assess progress in improving social mobility in the UK and to promote social mobility in England. The Commission board comprises:
Chair
Alun Francis OBE, Principal and Chief Executive of Blackpool and The Fylde College.
Deputy Chairs
Resham Kotecha, Head of Policy at the Open Data Institute.
Rob Wilson, Chairman at WheelPower – British Wheelchair Sport.
Commissioners
Dr Raghib Ali OBE, Senior Clinical Research Associate at the MRC Epidemiology Unit at the University of Cambridge.
Ryan Henson, Chief Executive Officer at the Coalition for Global Prosperity.
Parminder Kohli, Chair Shell UK Ltd and Shell Group Executive Vice President Sustainability and Carbon
Tina Stowell MBE, The Rt Hon Baroness Stowell of Beeston.
Introduction
The decision on what and where to study after school has a big impact on your future job opportunities and earnings.
This report aims to help young people, parents and teachers to make informed decisions about education after secondary school. It outlines the potential earnings associated with studying for qualifications at university and college. We break these down by both subject and institution.
Why is this important?
A survey of over 1200 young people in sixth form gave a snapshot of pupils’ information about potential earnings after graduating. Over 60% of respondents said that the potential salary after graduation is important when choosing where and what to study.
But is this information easily accessible?
Our survey finds that many students don’t know that salary information is available.
- One in four sixth formers did not know that salary information is available when considering a degree.
- One in three sixth formers considering vocational training qualifications (VTQ) did not know this information was available to help guide their decisions.
The survey found that students use different sources for salary information. Most students check their school’s website, career service sites like UCAS and Prospects, and government sources like the National Career Service.
What we mean by University and CollegeIn this accessible report, we use the term ‘university’ to describe higher education and ‘college’ to describe further education. What do these mean?
|
Many students don’t know where to find information. They need easy-to-find and easy-to-use information. The Social Mobility Commission (SMC) made this report to help young people, parents, teachers, and advisors access important information about the potential earnings from different educational choices.
This report aims to provide information on:
- How different qualifications influence your earnings
- How your earnings vary by subject and institution
- Where to access additional resources
We use information from our longer report: “Labour market value of higher and further education qualifications: a summary report”.
A couple of things to be aware of…The earnings ‘boost’ might change later on in your career In this report we talk about the ‘boost’ in earnings people tend to experience after a number of years following the completion of a qualification. For example, in some cases we measure the earnings ‘boost’ for people with 6 years of work experience after graduating from university. However, it is worth noting that this ‘boost’ in earnings might change later on in your career. The earnings ‘boost’ might depend on where in the UK you work How much you earn after studying for a qualification might depend on where in the UK you live and work. For example, salaries might be higher in London than in regions with a lower cost of living such as in the North East. For simplicity, we show the average ‘boost’ in earnings for the UK. |
Key findings
- Qualifications from university and college pay off. On average, people who study these qualifications in the UK tend to earn more money than those who don’t go to university or college.
- Getting qualifications at higher levels tends to lead to higher earnings. Even if we look at a person’s background or where they’re from, going to university or college typically leads to higher future earnings.
- Earnings vary by subject. At university, not all subjects are the same when it comes to boosting your potential earnings. Studying subjects like science, technology, engineering, and maths (STEM) often leads to a big boost in earnings. The same is true for law and economics.
- Climbing the qualification ladder at college can mean bigger paychecks. If you study for a qualification that’s at a higher level than what you have now, you tend to earn more in the future. For example, men with a level 4 qualification (such as a higher apprenticeship) earn on average 42% more than men with a level 3 or lower.
- In colleges, outcomes for earnings are not as simple. This is because there is not a lot of data to check different courses of study. But, subjects like business administration and engineering can help women and men earn more after a few years.
Different types of qualifications
It’s important to understand what qualifications exist before considering what earnings they might lead to. The figure below illustrates the types of qualifications across different levels.
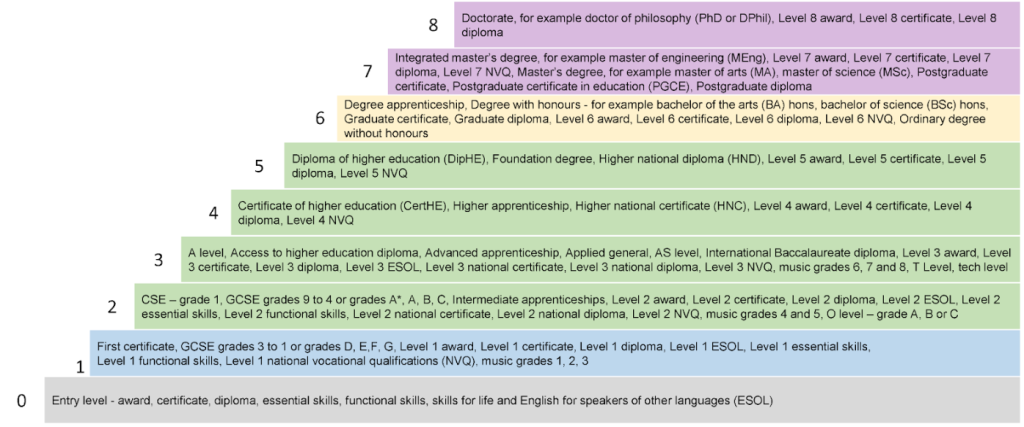
There are 9 qualification levels in England. For university, the information in this report relates to university degrees at level 6. For college, most of the information relates to qualifications at levels 2 to 5.
Higher education (university)
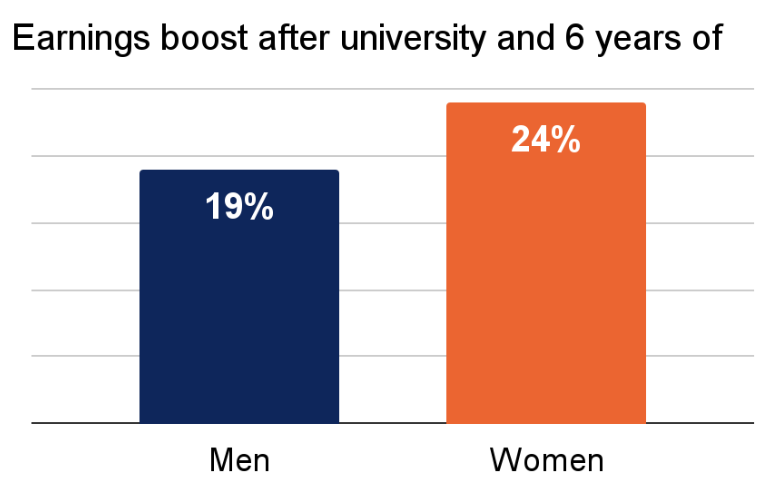
Research on the earnings boost from going to university shows that:
- After 6 years of work experience, incomes are on average 19% higher for men and 24% higher for women who went to university.
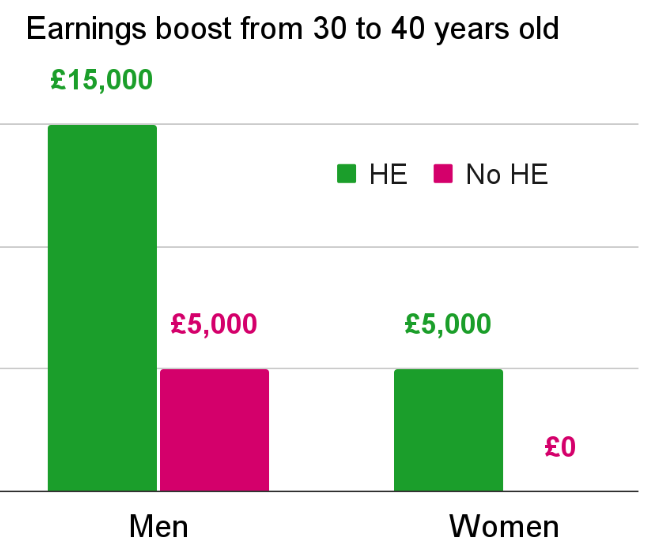
- The boost in earnings after attending university differs for men and women. On average, male graduates increased their earnings by £15,000 between the age of 30 and 40, compared to £5,000 for non-graduates. Female graduates increased their earnings by £5,000 between the ages of 30 and 40 compared to no change for female non-graduates.
Good grades also matterIn the UK, university grades are usually grouped into three categories:
If we look at boosts in earnings for the different grades we find that:
|
Subjects and earnings boost
- Studying economics and medicine tends to boost your future earnings by the highest amount.
- Men who study economics tend to earn 33% more by age 29 than men who didn’t go to university.
- Women in medicine can earn 75% more than those who didn’t attend university.
- In contrast, some subjects don’t tend to increase earnings. For example, men who study creative arts earn 14% less than men who didn’t go to university. Women who study creative arts only earn 9% more than those who didn’t go to university.
- Men who study creative arts, communications, English, agriculture, sociology, philosophy, or languages tend to earn less than men who didn’t go to university.
Top 5 earnings boosters |
|||
|---|---|---|---|
| Men | Women | ||
| Economics | 33% | Medicine | 75% |
| Medicine | 24% | Economics | 61% |
| Architecture | 19% | Maths | 42% |
| Business | 17% | Business | 41% |
| Law | 17% | Law | 40% |
Bottom 5 earnings boosters |
|||
| Men | Women | ||
| Comms | -2% | Veterinary science | 16% |
| Agriculture | -4% | Psychology | 15% |
| Philosophy | -4% | Social care | 14% |
| English | -7% | Agriculture | 11% |
| Creative arts | -14% | Creative arts | 9% |
| See in Table 1 of the Annex B information on boost in earnings for all the subjects | |||
However, it is not all about what you earn. Studying these subjects can have other advantages and open up opportunities in certain careers. For example, someone may study a qualification (such as art) that often leads to relatively low earnings but is more fulfilled in their career and life, or enter an occupation that better utilises their full talent and potential, and contributes to their social and emotional development.
Future earnings by university
Your future earnings can vary depending on the university you go to. We examined how earnings vary by university. Here’s what we discovered:
- For men at age 29, the earnings boost compared to those who didn’t go to university has a wide range, with Falmouth university being joint-bottom at 16% lower earnings and LSE at the top with 58% higher earnings.
- The same is true for women. Earnings can vary from a decrease of 11% for those studying at Bolton University to an increase of 94% for those attending LSE.
- Generally, Russell Group universities often lead to higher earnings, but exceptions exist. Many of them have fewer students from disadvantaged backgrounds.
Top 5 earnings boosters |
|||
|---|---|---|---|
| Men | Women | ||
| LSE | 58% | LSE | 94% |
| Imperial | 47% | Imperial | 68% |
| Oxford | 44% | Harper Adams | 50% |
| Cambridge | 34% | UCL | 45% |
| Bristol | 32% | Oxford | 45% |
Bottom 5 earnings boosters |
|||
| Men | Women | ||
| Ravensbourne | -11% | Bangor | 5% |
| Bath Spa | -14% | Wales Trinity St David | 1% |
| Glamorgan | -16% | Writtle C | -6% |
| Leeds City | -16% | UC Falmouth | -8% |
| UC Falmouth | -16% | Bolton | -11% |
| See in Table 2.1 and 2.2 in the Annex B information boost in earnings for all the universities | |||
Going to a Russell Group university can help you earn more. But getting into selective universities is hard. If students from some backgrounds find it harder to get into these universities, it can affect their future earnings and social mobility.
University typesExamples of how universities are grouped:
|
Courses at universities: Which of these have the highest earnings boost?
Looking at subjects (such as economics) or universities (such as Nottingham University) on their own, doesn’t give you the full picture. It’s better to consider them together (such as by looking at economics at Nottingham University).
However, it’s harder to do this. It’s hard to accurately determine how much a certain subject at a certain university boosts your earnings. This is because we have data for only a small group of students.
Earnings boost by subject and university |
||
|---|---|---|
| Law | ||
| 1 | Cambridge | 108% |
| 2 | Oxford | 92% |
| 3 | UCL | 88% |
| Economics | ||
| 1 | Cambridge | 127% |
| 2 | UCL | 108% |
| 3 | St Andrews | 97% |
| Medicine | ||
| 1 | Aberdeen | 88% |
| 2 | Hull | 78% |
| 3 | Edinburgh | 77% |
| Creative arts | ||
| 1 | Durham | 13% |
| 2 | Warwick | 12% |
| 3 | Bournemouth | 9% |
We find:
- Subjects such as law, economics, maths and business have the highest earnings boost at Russell group universities. This is followed by pre-1992 universities and then post-1992 universities.
- Across all university groups, people who study creative arts experience the smallest earnings boost.
Check Tables 3 in the Annex B for complete information of boost in earnings by subjects and universities
College education (vocational and technical courses, apprenticeships among other options)
Main challenges in understanding earnings boosts from collegeSome college qualifications, like levels 4 and 5, have very few students, so it’s hard to be sure about how qualifications affect earnings. Also, the college system has gone through a lot of changes, especially in the last ten years. New qualifications were made, and existing ones were changed. This makes it even more challenging to study. |
Understanding how qualifications from college can increase earnings is more complicated than for university courses. This is because there are many more college qualifications and these may be taken by a smaller number of students.
Becoming more qualified tends to pay off
If you get a qualification at a higher level than what you already have, it usually means that you will earn more. However, the amount by which your earnings might increase is harder for us to determine. This is because there are various pathways and qualifications at different levels, and a lot of variation in returns by where you choose to study.
Some research finds that men with a level 4 qualification earn 42% more than similar men with a level 3 qualification.
Whereas, women with a level 5 qualification earn 57% more than similar women with a level 3 qualification.
Intermediate and advanced apprenticeships
Apprenticeships at different levels can help you earn more than other vocational qualifications, but the effect depends on your work field. Women often pick lower-paying sectors such as social care, so apprenticeships tend to have a bigger impact on men’s pay who often choose higher-paying sectors such as construction and engineering.
Subjects and earnings boost
Fewer people study at colleges than universities, and there are many courses and qualifications. As a result, understanding the earnings boost from colleges is more challenging.
However, some research shows that young men who study engineering and manufacturing technology, business administration and law at college tend to earn more compared to those who study different subjects such as history, arts and agriculture. This may suggest that subjects in engineering and manufacturing, business and law may lead to higher paying careers or help develop a skillset which employers are willing to pay more for.
Women who study subjects such as arts and media, business administration or law also tend to have higher earnings compared to women who study other subjects such as languages and social care.
Future earnings by college
There are significant differences in how colleges affect your future earnings. Research shows that moving from a low-performing college to a high-performing one could increase your earnings by about 3%. More research is needed to understand the link between college choice, teaching style, and your earnings potential.
What about the type of teaching?College courses are taught in a variety of ways such as in the workplace, in the classroom or as distance courses. Classroom courses boost earnings more than workplace or distance courses. Colleges that focus on competency-based assessments over exams may not boost earnings as much. |
Annex A: Understanding value-add
What is Value-Add in earnings?
Value-add can be thought of as the average boost in earnings you get from your education beyond the age of 16 – whether it is university or college. It’s the extra money you can earn because you went to university or college. This extra money shows how studying helps you earn more compared to someone who didn’t do that qualification.
To determine how much money you make after getting a degree or completing a course, we consider various factors. These factors include your location, if you received free school meals, and the type of school you attended. These factors can influence your earnings.
Why does value-add matter?
What you earn after finishing a qualification is one of many important factors to consider when choosing what to study. In this report we present the ‘earnings boost’ people on average achieve after gaining a qualification after their school-years.
Why do we need to be careful?
When we calculate the boost in earnings, we need to make some assumptions. This is because there could be some hidden things which drive your earnings and as we don’t observe these things, it is hard to factor them in. For example your motivation, personal aspirations and personality may also influence how much you go on to earn after studying for a qualification. We should also note that the ‘earnings boost’ we estimate is just an average – this means not everyone gets the same salary. So, one person might earn more, and another might earn less after studying for the same qualification. It’s not a guarantee of how much you will make but it can be a good indicator of what your earnings potential is a few years after completing your qualification.
Annex B: Data tables of boost in earnings
At this stage, we only have the data tables of boost in earnings for universities. This is because there are many more courses and qualifications at college than at university and these tend to be taken by fewer people. There is also more variation in the type of people who study college courses. This means understanding the earnings boost from colleges is more challenging.
Table 1: Value-add in earnings by subject for men and women
| Men | Women | |||||
| 1 | Economics | 33% | 1 | Medicine | 75% | |
| 2 | Medicine | 24% | 2 | Economics | 61% | |
| 3 | Architecture | 19% | 3 | Maths | 42% | |
| 4 | Business | 17% | 4 | Business | 41% | |
| 5 | Law | 17% | 5 | Law | 40% | |
| 6 | Computing | 14% | 6 | Engineering | 39% | |
| 7 | Engineering | 13% | 7 | Pharmacology | 39% | |
| 8 | Education | 12% | 8 | Computing | 38% | |
| 9 | Maths | 8% | 9 | Physics | 35% | |
| 10 | Physics | 7% | 10 | Nursing | 34% | |
| 11 | Politics | 6% | 11 | Politics | 33% | |
| 12 | Geography | 6% | 12 | Architecture | 29% | |
| 13 | Technology | 6% | 13 | Geography | 28% | |
| 14 | Pharmacology | 4% | 14 | Comms | 27% | |
| 15 | Allied to med | 4% | 15 | Technology | 27% | |
| 16 | Sportsci | 3% | 16 | Sport Science | 26% | |
| 17 | Sociology | 2% | 17 | Allied to med | 25% | |
| 18 | Biosciences | 1% | 18 | Education | 24% | |
| 19 | Physsci | 1% | 19 | Sociology | 23% | |
| 20 | History | 1% | 20 | Languages | 23% | |
| 21 | Languages | -1% | 21 | Biosciences | 22% | |
| 22 | Psychology | -1% | 22 | Physical science | 22% | |
| 23 | Comms | -2% | 23 | English | 21% | |
| 24 | Agriculture | -4% | 24 | History | 21% | |
| 25 | Philosophy | -4% | 25 | Philosophy | 20% | |
| 26 | English | -7% | 26 | Veterinary science | 16% | |
| 27 | Creative arts | -14% | 27 | Psychology | 15% | |
| 28 | Social care | 14% | ||||
| 29 | Agriculture | 11% | ||||
| 30 | Creative arts | 9% | ||||
Table 2.1: Value-add in earnings by university for men
| 1 | LSE | 58% | 30 | Sheffield | 14% | 59 | Central Lancashire | 3% | 88 | UC Birmingham | -2% | |||
| 2 | Imperial | 47% | 31 | Portsmouth | 14% | 60 | Leeds Met | 3% | 89 | Lincoln | -2% | |||
| 3 | Oxford | 44% | 32 | Hertfordshire | 13% | 61 | Edge Hill | 2% | 90 | Manchester Met | -2% | |||
| 4 | Cambridge | 34% | 33 | Leeds | 13% | 62 | Hull | 2% | 91 | Buckingham New | -3% | |||
| 5 | Bristol | 32% | 34 | Bournemouth | 12% | 63 | Sunderland | 2% | 92 | Roehampton | -3% | |||
| 6 | UCL | 30% | 35 | Swansea | 12% | 64 | L’pool John Moores | 2% | 93 | London South Bank | -3% | |||
| 7 | Bath | 28% | 36 | Aston | 11% | 65 | Chester | 2% | 94 | U Creative Arts | -3% | |||
| 8 | Warwick | 27% | 37 | Manchester | 11% | 66 | London Met | 2% | 95 | Cumbria | -4% | |||
| 9 | Harper Adams | 27% | 38 | Royal Holloway | 10% | 67 | Greenwich | 1% | 96 | Bedfordshire | -4% | |||
| 10 | Loughborough | 26% | 39 | UEA | 10% | 68 | Glasgow | 1% | 97 | Wales Trinity St David | -4% | |||
| 11 | City | 26% | 40 | Lancaster | 9% | 69 | Coventry | 1% | 98 | Gloucestershire | -4% | |||
| 12 | Durham | 24% | 41 | U West England | 9% | 70 | Kingston | 1% | 99 | Derby | -4% | |||
| 13 | Nottingham | 22% | 42 | Keele | 9% | 71 | East London | 0% | 100 | L’pool Hope | -4% | |||
| 14 | Exeter | 22% | 43 | Chichester | 9% | 72 | Teesside | 0% | 101 | Wolverhampton | -5% | |||
| 15 | Oxford Brookes | 21% | 44 | Liverpool | 9% | 73 | Bradford | 0% | 102 | Bangor | -5% | |||
| 16 | Reading | 21% | 45 | Kent | 9% | 74 | Anglia Ruskin | 0% | 103 | Arts Inst Bournemouth | -6% | |||
| 17 | York | 21% | 46 | Essex | 8% | 75 | Salford | 0% | 104 | Goldsmiths | -7% | |||
| 18 | Surrey | 20% | 47 | Royal Agricultural C | 8% | 76 | York St John UC | 0% | 105 | West London | -8% | |||
| 19 | Brunel | 19% | 48 | Prifysgol Aberystwyth | 8% | 77 | Winchester | 0% | 106 | U Arts London | -9% | |||
| 20 | Newcastle | 19% | 49 | Northampton | 8% | 78 | Birmingham City | 0% | 107 | Middlesex | -10% | |||
| 21 | Cardiff | 19% | 50 | De Montfort | 7% | 79 | Plymouth | 0% | 108 | Bolton | -11% | |||
| 22 | Birmingham | 17% | 51 | S’ton Solent | 7% | 80 | Westminster | -1% | 109 | Ravensbourne | -11% | |||
| 23 | Edinburgh | 16% | 52 | Brighton | 7% | 81 | Cardiff Met | -1% | 110 | Bath Spa | -14% | |||
| 24 | KCL | 16% | 53 | Aberdeen | 6% | 82 | Canterbury Christchuch | -1% | 111 | Glamorgan | -16% | |||
| 25 | Southampton | 16% | 54 | Northumbria | 6% | 83 | SOAS | -1% | 112 | Leeds City | -16% | |||
| 26 | Nottingham Trent | 15% | 55 | Sussex | 6% | 84 | St Mark & St John | -1% | 113 | UC Falmouth | -16% | |||
| 27 | St Mary’s UC Twickeham | 15% | 56 | Sheffield Hallam | 6% | 85 | Staffordshire | -1% | ||||||
| 28 | St Andrews | 14% | 57 | Leicester | 4% | 86 | Worcester | -1% | ||||||
| 29 | QMU | 14% | 58 | Leeds Trinity | 4% | 87 | Huddersfield | -1% |
Table 2.2: Value-add in earnings by university for women
| 1 | LSE | 94% | 31 | Westminster | 29% | 61 | Bishop Grosseteste | 21% | 91 | Roehampton | 14% | |||
| 2 | Imperial | 68% | 32 | Newman | 29% | 62 | De Montfort | 20% | 92 | Northampton | 14% | |||
| 3 | Harper Adams | 50% | 33 | Cambridge | 29% | 63 | Swansea | 20% | 93 | Bradford | 14% | |||
| 4 | UCL | 45% | 34 | Keele | 28% | 64 | Huddersfield | 20% | 94 | Worcester | 14% | |||
| 5 | Oxford | 45% | 35 | Greenwich | 28% | 65 | St George’s Hospital | 20% | 95 | Royal Veterinary C | 13% | |||
| 6 | Bath | 43% | 36 | Nottingham Trent | 28% | 66 | York | 20% | 96 | Anglia Ruskin | 13% | |||
| 7 | KCL | 43% | 37 | Edinburgh | 28% | 67 | Birmingham City | 20% | 97 | York St John UC | 13% | |||
| 8 | Durham | 43% | 38 | Brighton | 27% | 68 | Essex | 19% | 98 | Glamorgan | 12% | |||
| 9 | Bristol | 40% | 39 | Portsmouth | 26% | 69 | Chester | 19% | 99 | Plymouth | 12% | |||
| 10 | Nottingham | 40% | 40 | Oxford Brookes | 25% | 70 | Goldsmiths | 19% | 100 | Sunderland | 12% | |||
| 11 | Loughborough | 39% | 41 | U Arts London | 25% | 71 | Royal Holloway | 19% | 101 | Derby | 12% | |||
| 12 | Liverpool | 38% | 42 | Sussex | 25% | 72 | UEA | 18% | 102 | Royal Agricultural C | 11% | |||
| 13 | SOAS | 38% | 43 | Aston | 25% | 73 | Edge Hill | 18% | 103 | Gloucestershire | 11% | |||
| 14 | Surrey | 37% | 44 | Reading | 25% | 74 | Bedfordshire | 18% | 104 | Staffordshire | 11% | |||
| 15 | Bournemouth | 36% | 45 | Kent | 25% | 75 | Lincoln | 18% | 105 | London Met | 11% | |||
| 16 | Southampton | 36% | 46 | S’ton Solent | 24% | 76 | Coventry | 18% | 106 | Cumbria | 10% | |||
| 17 | QMU | 36% | 47 | St Andrews | 24% | 77 | Canterbury Christchuch | 18% | 107 | Prifysgol Aberystwyth | 10% | |||
| 18 | Warwick | 36% | 48 | St Mary’s UC Twickeham | 24% | 78 | Salford | 17% | 108 | Chichester | 10% | |||
| 19 | Birmingham | 35% | 49 | East London | 24% | 79 | L’pool John Moores | 17% | 109 | St Mark & St John | 9% | |||
| 20 | Leeds | 35% | 50 | UC Birmingham | 24% | 80 | Leeds Met | 17% | 110 | Cental Lancashire | 8% | |||
| 21 | Cardiff | 34% | 51 | Leicester | 24% | 81 | Glasgow | 17% | 111 | Teesside | 8% | |||
| 22 | City | 33% | 52 | Hertfordshire | 24% | 82 | U Creative Arts | 17% | 112 | Ravensbourne | 8% | |||
| 23 | Manchester | 33% | 53 | Lancaster | 23% | 83 | U West England | 17% | 113 | Norwich UC Arts | 7% | |||
| 24 | Newcastle | 33% | 54 | Exeter | 23% | 84 | Arts Inst Bournemouth | 17% | 114 | Bangor | 5% | |||
| 25 | Sheffield | 32% | 55 | Central Sch Speech/Drama | 23% | 85 | Wolverhampton | 16% | 115 | Wales Trinity St David | 1% | |||
| 26 | Brunel | 31% | 56 | L’pool Hope | 23% | 86 | Manchester Met | 16% | 116 | Writtle C | -6% | |||
| 27 | Kingston | 31% | 57 | Middlesex | 22% | 87 | Winchester | 16% | 117 | UC Falmouth | -8% | |||
| 28 | Leeds Trinity | 31% | 58 | Cardiff Met | 22% | 88 | Buckingham New | 16% | 118 | Bolton | -11% | |||
| 29 | Hull | 30% | 59 | Sheffield Hallam | 22% | 89 | London South Bank | 16% | ||||||
| 30 | West London | 30% | 60 | Northumbria | 22% | 90 | Bath Spa | 16% |
Value-add in earnings by university and subject
Please note, these figures are only estimates. They represent a ‘best guess’ of how much more you might earn on average when compared to someone similar to you who didn’t attend university. Caution should be taken when interpreting these figures as there is a lot of uncertainty over what the actual impact on your earnings might be. This is because your earnings depend on a wide range of factors. We do not advise you to make any decisions on which university to study at based on these figures alone. Instead, we encourage you to consider these estimates alongside a wide range of resources.
These estimates come from the appendix in ‘How much does degree choice matter?’ published by the Institute of Fiscal Studies in 2021.
Table 3.1: Value-add in earnings at age 30 by university for people who studied law
Note: All value-add figures are relative to someone of a similar background who studied History at Sheffield Hallam University. For example, a value-add of 100% means that the average person who studied a given subject at a given university earns twice as much as someone of a similar background (in terms of school grades, gender, region they went to school in and socio-economic background) who studied History at Sheffield Hallam University.
| Rank | University | Value-add (in%) |
| 1 | University of Cambridge | 108% |
| 2 | Oxford University | 92% |
| 3 | University College London | 88% |
| 4 | University of Durham | 87% |
| 5 | University of Nottingham | 80% |
| 6 | London School of Economics and Political Science | 75% |
| 7 | University of Exeter | 65% |
| 8 | King’s College London | 65% |
| 9 | University of Bristol | 59% |
| 10 | University of Birmingham | 54% |
| 11 | University of Newcastle Upon Tyne | 52% |
| 12 | School of Oriental and African Studies | 51% |
| 13 | Queen Mary, University of London | 49% |
| 14 | University of Reading | 48% |
| 15 | University of East Anglia | 46% |
| 16 | University of Manchester | 44% |
| 17 | University of Southampton | 42% |
| 18 | University of Warwick | 41% |
| 19 | University of Sheffield | 38% |
| 20 | University of Leeds | 37% |
| 21 | Liverpool Hope University | 33% |
| 22 | Cardiff University | 30% |
| 23 | University of Northumbria at Newcastle | 29% |
| 24 | University of Buckingham | 29% |
| 25 | University of Essex | 28% |
| 26 | University of Surrey | 28% |
| 27 | City University | 27% |
| 28 | University of Liverpool | 26% |
| 29 | Swansea University | 26% |
| 30 | Keele University | 26% |
| 31 | Lancaster University | 26% |
| 32 | University of Sussex | 25% |
| 33 | University of Hull | 24% |
| 34 | Prifysgol Aberystwyth | 23% |
| 35 | University of Leicester | 23% |
| 36 | University of Westminster | 23% |
| 37 | University of Portsmouth | 21% |
| 38 | University of the West of England, Bristol | 21% |
| 39 | University of Glamorgan | 21% |
| 40 | Brunel University | 21% |
| 41 | University of Kent | 20% |
| 42 | Nottingham Trent University | 20% |
| 43 | Bournemouth University | 18% |
| 44 | University of Brighton | 16% |
| 45 | Oxford Brookes University | 15% |
| 46 | Kingston University | 15% |
| 47 | Southampton Solent University | 14% |
| 48 | University of Bradford | 14% |
| 49 | Liverpool John Moores University | 13% |
| 50 | University of Greenwich | 12% |
| 51 | Manchester Metropolitan University | 11% |
| 52 | Sheffield Hallam University | 11% |
| 53 | Leeds Metropolitan University | 7% |
| 54 | Canterbury Christ Church University | 7% |
| 55 | Bangor University | 6% |
| 56 | Middlesex University | 6% |
| 57 | University of Sunderland | 4% |
| 58 | University of Plymouth | 4% |
| 59 | London South Bank University | 4% |
| 60 | University of Huddersfield | 3% |
| 61 | Staffordshire University | 3% |
| 62 | University of Gloucestershire | 2% |
| 63 | University of Hertfordshire | 1% |
| 64 | University Of Teesside | 0% |
| 65 | Birmingham City University | 0% |
| 66 | University of Central Lancashire | -1% |
| 67 | University of Lincoln | -3% |
| 68 | University of East London | -3% |
| 69 | Coventry University | -4% |
| 70 | Edge Hill University | -5% |
| 71 | University of Derby | -6% |
| 72 | Anglia Ruskin University | -6% |
| 73 | De Montfort University | -6% |
| 74 | University of Wolverhampton | -9% |
| 75 | University of Northampton | -9% |
| 76 | Buckinghamshire New University | -9% |
| 77 | University of Bedfordshire | -12% |
| 78 | London Metropolitan University | -20% |
Table 3.2: Value-add in earnings at age 30 by university for people who studied Economics
Note: All value-add figures are relative to someone of a similar background who studied History at Sheffield Hallam University. For example, a value-add of 100% means that the average person who studied a given subject at a given university earns twice as much as someone of a similar background (in terms of school grades, gender, region they went to school in and socio-economic background) who studied History at Sheffield Hallam University.
| Rank | University | Value-add in earnings (%) |
| 1 | University of Cambridge | 127% |
| 2 | University College London | 108% |
| 3 | University of St Andrews | 97% |
| 4 | University of Warwick | 96% |
| 5 | Oxford University | 94% |
| 6 | University of Edinburgh | 86% |
| 7 | University of Durham | 83% |
| 8 | University of Bristol | 77% |
| 9 | University of Sussex | 77% |
| 10 | London School of Economics and Political Science | 75% |
| 11 | University of Birmingham | 74% |
| 12 | University of Bath | 72% |
| 13 | University of York | 71% |
| 14 | University of Nottingham | 69% |
| 15 | University of Exeter | 65% |
| 16 | London Metropolitan University | 65% |
| 17 | University of Southampton | 65% |
| 18 | University of Newcastle Upon Tyne | 64% |
| 19 | Loughborough University | 62% |
| 20 | University of Northumbria at Newcastle | 59% |
| 21 | City University | 58% |
| 22 | Royal Holloway, | 57% |
| 23 | University of Liverpool | 54% |
| 24 | University of Reading | 54% |
| 25 | Queen Mary, University of London | 54% |
| 26 | University of Portsmouth | 53% |
| 27 | University of Sheffield | 52% |
| 28 | University of East Anglia | 51% |
| 29 | University of Central Lancashire | 49% |
| 30 | University of Leeds | 47% |
| 31 | Brunel University | 45% |
| 32 | University of Leicester | 43% |
| 33 | University of the West of England, Bristol | 42% |
| 34 | University of Manchester | 41% |
| 35 | Cardiff University | 41% |
| 36 | Nottingham Trent University | 40% |
| 37 | University of Bradford | 40% |
| 38 | Keele University | 39% |
| 39 | Coventry University | 38% |
| 40 | University of Essex | 35% |
| 41 | School of Oriental and African Studies | 35% |
| 42 | University of Surrey | 34% |
| 43 | University of Plymouth | 32% |
| 44 | University of Hertfordshire | 31% |
| 45 | Kingston University | 30% |
| 46 | Leeds Metropolitan University | 29% |
| 47 | Manchester Metropolitan University | 28% |
| 48 | Swansea University | 25% |
| 49 | University of Hull | 25% |
| 50 | Liverpool John Moores University | 25% |
| 51 | Lancaster University | 23% |
| 52 | University of Kent | 19% |
| 53 | University of Salford | 17% |
| 54 | University of Greenwich | 16% |
| 55 | Oxford Brookes University | 16% |
| 56 | Goldsmiths College | 16% |
| 57 | Prifysgol Aberystwyth | 15% |
| 58 | Middlesex University | 12% |
Table 3.3: Value-add in earnings at age 30 by university for people who studied medicine
Note: All value-add figures are relative to someone of a similar background who studied History at Sheffield Hallam University. For example, a value-add of 100% means that the average person who studied a given subject at a given university earns 50% more than someone of a similar background (in terms of school grades, gender, region they went to school in and socio-economic background) who studied History at Sheffield Hallam University.
| Rank | University | Value-add in earnings (%) |
| 1 | University of Aberdeen | 88% |
| 2 | University of Hull | 78% |
| 3 | University of Edinburgh | 77% |
| 4 | University of Liverpool | 70% |
| 5 | University of Sussex | 66% |
| 6 | University of St Andrews | 66% |
| 7 | University of East Anglia | 66% |
| 8 | University of Newcastle Upon Tyne | 66% |
| 9 | University of Sheffield | 64% |
| 10 | University of Exeter | 62% |
| 11 | University of Brighton | 60% |
| 12 | Keele University | 59% |
| 13 | St George’s Hospital Medical School | 58% |
| 14 | Cardiff University | 57% |
| 15 | University of Plymouth | 57% |
| 16 | Oxford University | 57% |
| 17 | University of Cambridge | 54% |
| 18 | University of Bristol | 53% |
| 19 | University College London | 53% |
| 20 | University of York | 53% |
| 21 | University of Glasgow | 52% |
| 22 | Imperial College London | 51% |
| 23 | University of Birmingham | 51% |
| 24 | University of Nottingham | 50% |
| 25 | University of Southampton | 49% |
| 26 | University of Leeds | 43% |
| 27 | University of Manchester | 42% |
| 28 | King’s College London | 41% |
| 29 | Queen Mary, University of London | 37% |
| 30 | University of Leicester | 31% |
| 31 | University of Dundee | 17% |
Table 3.4: Value-add in earnings at age 30 by university for people who studied creative arts
Note: All value-add figures are relative to someone of a similar background who studied History at Sheffield Hallam University. For example, a value-add of 100% means that the average person who studied a given subject at a given university earns 50% more than someone of a similar background (in terms of school grades, gender, region they went to school in and socio-economic background) who studied History at Sheffield Hallam University.
| Rank | University | Value-add in earnings (%) |
| 1 | University of Durham | 13% |
| 2 | University of Warwick | 12% |
| 3 | Bournemouth University | 9% |
| 4 | Brunel University | 9% |
| 5 | Oxford University | 8% |
| 6 | Nottingham Trent University | 6% |
| 7 | University of Sheffield | 5% |
| 8 | King’s College London | 3% |
| 9 | Cardiff University | 2% |
| 10 | University of Liverpool | 1% |
| 11 | Loughborough University | -1% |
| 12 | Coventry University | -2% |
| 13 | Central School of Speech and Drama | -2% |
| 14 | Liverpool John Moores University | -2% |
| 15 | University of Birmingham | -3% |
| 16 | Lancaster University | -3% |
| 17 | University of Huddersfield | -3% |
| 18 | University of Nottingham | -4% |
| 19 | Keele University | -4% |
| 20 | Queen Mary, University of London | -4% |
| 21 | Leeds Metropolitan University | -4% |
| 22 | Southampton Solent University | -4% |
| 23 | Edge Hill University | -5% |
| 24 | Queen Margaret University, Edinburgh | -5% |
| 25 | University of Northumbria at Newcastle | -5% |
| 26 | Royal Holloway, | -6% |
| 27 | University of Kent | -6% |
| 28 | University of Bristol | -6% |
| 29 | St Mary’s University College, Twickenham | -6% |
| 30 | University of East London | -6% |
| 31 | Birmingham City University | -6% |
| 32 | Royal Northern College of Nursing | -7% |
| 33 | Roehampton University | -7% |
| 34 | University of Winchester | -7% |
| 35 | University of Wolverhampton | -7% |
| 36 | Cardiff Metropolitan University | -8% |
| 37 | University of Sunderland | -8% |
| 38 | Kingston University | -8% |
| 39 | De Montfort University | -8% |
| 40 | University of Hull | -8% |
| 41 | University of Wales Trinity Saint David | -8% |
| 42 | University of Gloucestershire | -9% |
| 43 | University of Reading | -9% |
| 44 | University of York | -9% |
| 45 | Sheffield Hallam University | -9% |
| 46 | University of Leeds | -9% |
| 47 | Buckinghamshire New University | -9% |
| 48 | University of Salford | -9% |
| 49 | University of Portsmouth | -9% |
| 50 | University of Newcastle Upon Tyne | -9% |
| 51 | University Of Teesside | -9% |
| 52 | University of Exeter | -10% |
| 53 | University of the West of England, Bristol | -10% |
| 54 | Bishop Grosseteste University College Lincoln | -11% |
| 55 | University for the Creative Arts (Formerly University College for the Creative Arts) | -11% |
| 56 | University of Lincoln | -11% |
| 57 | University of Worcester | -11% |
| 58 | University of West London | -11% |
| 59 | Oxford Brookes University | -12% |
| 60 | University of Manchester | -12% |
| 61 | University of Chester | -12% |
| 62 | University of Hertfordshire | -12% |
| 63 | University of Bedfordshire | -12% |
| 64 | University of Surrey | -12% |
| 65 | Guildhall School of Music and Dance | -12% |
| 66 | Norwich University College of the Arts | -12% |
| 67 | Leeds City College | -12% |
| 68 | Staffordshire University | -13% |
| 69 | Prifysgol Aberystwyth | -13% |
| 70 | Manchester Metropolitan University | -13% |
| 71 | York St John University College | -13% |
| 72 | University of Westminster | -13% |
| 73 | Middlesex University | -13% |
| 74 | University of East Anglia | -14% |
| 75 | University of Central Lancashire | -14% |
| 76 | Edinburgh Napier University | -14% |
| 77 | Canterbury Christ Church University | -14% |
| 78 | Royal Conservatoire of Scotland | -14% |
| 79 | University of Cambridge | -15% |
| 80 | University of Northampton | -15% |
| 81 | University of Glamorgan | -15% |
| 82 | University of the Arts London | -15% |
| 83 | University of Greenwich | -15% |
| 84 | University of Derby | -16% |
| 85 | Arts Institute at Bournemouth | -16% |
| 86 | Glyndwr University | -16% |
| 87 | Anglia Ruskin University | -16% |
| 88 | University of Cumbria | -16% |
| 89 | University of Plymouth | -16% |
| 90 | Ravensbourne | -17% |
| 91 | University of Bolton | -17% |
| 92 | Bath Spa University | -17% |
| 93 | University of Brighton | -17% |
| 94 | University of Chichester | -18% |
| 95 | Royal College of Music | -18% |
| 96 | Royal Academy of Music | -18% |
| 97 | Liverpool Hope University | -18% |
| 98 | Trinity LABAN Conservatoire of Music and Dance | -19% |
| 99 | Rose Bruford College | -20% |
| 100 | University of Southampton | -20% |
| 101 | University of Essex | -20% |
| 102 | Goldsmiths College | -21% |
| 103 | University of Edinburgh | -21% |
| 104 | Bangor University | -22% |
| 105 | Liverpool Institute for Performing Arts | -23% |
| 106 | Newman University College, Birmingham | -23% |
| 107 | City University | -25% |
| 108 | Conservatoire for Dance and Drama | -25% |
| 109 | University College Falmouth | -25% |
| 110 | London Metropolitan University | -25% |
| 111 | University of St Mark & St John | -27% |
| 112 | Glasgow School of Art | -27% |
| 113 | London South Bank University | -29% |
| 114 | University of Glasgow | -29% |
| 115 | University College London | -31% |
| 116 | University of Sussex | -33% |