How to use the Local Innovation and Economic Dynamism Tool
Exploring local economic dynamism across the UK
The interactive map is designed to help users explore patterns of economic dynamism across UK regions and understand the indicators that make up the index. Importantly, the tool focuses on rates and flows that capture current economic activity and change, rather than static measures of accumulated wealth. This distinction prevents already wealthy areas from automatically rising to the top of the rankings regardless of how dynamic their subregional economies are today. Data can be viewed at several geographic levels, including ITL1 regions, ITL3 regions, local authorities and MCAs (Mayoral Combined Authorities). This makes it possible to compare places within a local area, across wider regions and across the country as a whole.
Reading the map: scores, rankings and spatial patterns
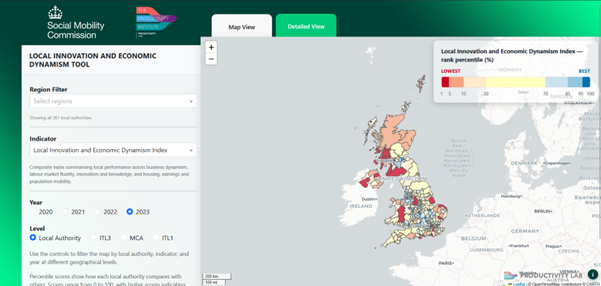
The screenshot above shows the first page users see when they open the tool. The map displays the selected indicator, in this case the Local Innovation and Economic Dynamism index, for local authorities across the UK. Places are coloured according to their ranked percentile. Local authorities in the top 5 percentiles (95th -100th percentile), with the highest index values, are shown in blue. Those in the bottom 5 percentiles (1st-5th percentile), with the lowest index values, are shown in red.
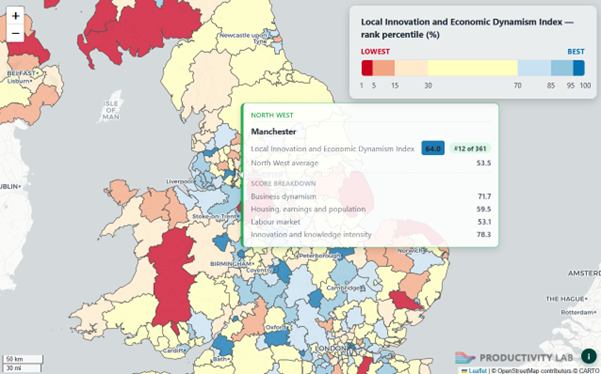
When users hover over a region such as Manchester with these settings applied, the tool displays a summary window. In this example, the blue figure shows that Manchester has a Local Innovation and Economic Dynamism index score of 64, placing it in the top 5th percentile of the UK. The rank, 12 out of 361, indicates Manchester’s position relative to all UK local authorities. The comparison value below shows the average score for the wider ITL1 region, in this case a score of 53.5 for the North West of England. The window also breaks down Manchester’s performance across the four main components of the index, showing each individual score of the region the user hovers over.
Customising the analysis
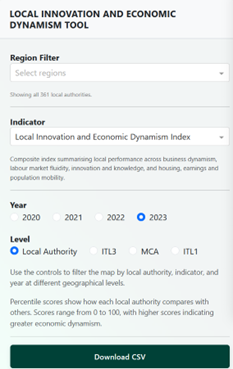
The sidebar lets users customise the analysis to fit their needs. Users can select multiple regions and rank them within a subnational area or outside the national context. The list of indicators allows users to explore the variables that make up the Local Innovation and Economic Dynamism Index, helping identify where a place performs strongly and where there may be scope for improvement. The dataset spans 2020 to 2023, so users can compare years, examine how places change over time, and see the trajectory of different regions. The geographic-level selector determines the scale of the analysis, from broad regional comparisons to more detailed analysis of individual local authorities.
Using the detailed view for deeper comparison
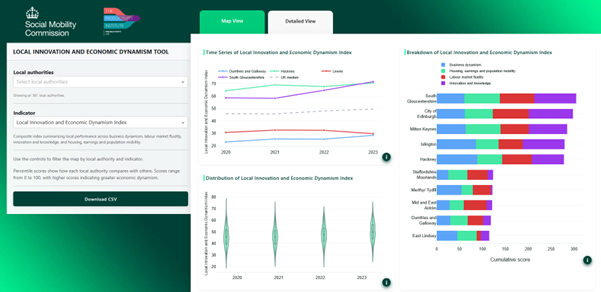
While the map view provides an overview of spatial performance patterns, the detailed view offers a more granular analysis of the index and its underlying components. It presents a series of visualisations that let users explore index values and component-level performance across selected regions and changes over time.
Tracking change over time
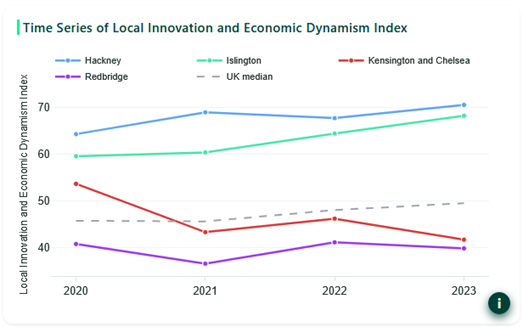
The plot in the top left of the detailed view shows how the selected indicator changes over time. The index takes values between 0 and 100. In the example above, the Local Innovation and Economic Dynamism index is shown for the two highest- and two lowest-performing local authorities in London in 2023, out of 33 local authorities. The dotted line shows the UK median, which helps contextualise London’s local authorities in the broader national context. Information bubbles in the bottom right of the figures provide further explanation of the visualisations and a link to the sources and methodology supporting documentation.
Understanding index components
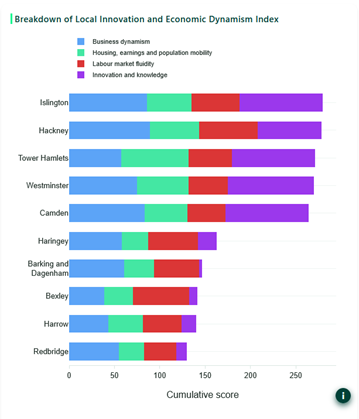
The bar chart on the right-hand side of the Detailed View breaks down the Local Innovation and Economic Dynamism Index into its component measures. In this London example, the chart shows the five highest and five lowest cumulative component scores across London’s 33 local authorities. Islington ranks above Hackney in this chart, but not in the time series chart, because the overall index used in the time series is weighted using principal component analysis. In contrast, the cumulative scores in the bar chart give each component equal weight. This distinction helps users understand why different visualisations may produce different rankings.
Comparing distributions across places
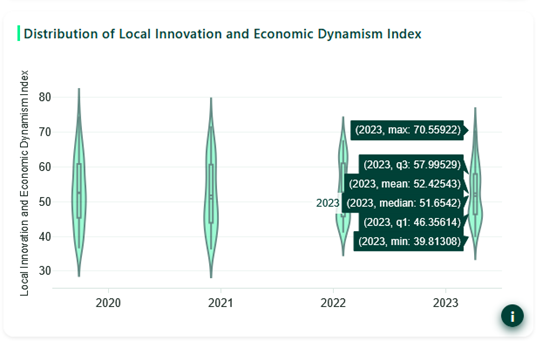
The violin chart in the bottom left of the detailed view shows the distribution of values within the selected group of places. In the example above, it shows the distribution of the Local Innovation and Economic Dynamism index across London’s local authorities for each available year. Users can hover over each violin to see summary statistics, including the mean, median, quartiles, min, and max values. This is particularly useful for benchmarking a larger region’s performance over time and understanding whether variation between local areas is widening, narrowing, or remaining stable.
Conclusion: from evidence to local insight
The Local Innovation and Economic Dynamism Tool provides an accessible way to explore how places across the UK compare on different dimensions of local economic dynamism. By combining maps, rankings, component-level indicators and changes over time, the tool helps users move beyond headline figures and examine the specific strengths and challenges shaping local economies.
For policymakers, analysts, researchers, and local partners, this makes the tool useful for both diagnosis and discussion. It can support comparisons between similar places, identify areas where performance is improving or weakening, and help inform more targeted, evidence-led approaches to local innovation, productivity and inclusive growth.